
Pew Research Center has gathered data around some of this year’s most pivotal news stories, from the U.S. presidential election and international conflicts to debates over immigration and the role of social media in society.
Here’s a look back at 2024 through 14 of our most striking research findings. These are just a small slice of the Center’s many research publications from this year.
(In these findings, Republicans and Democrats also include independents who lean toward each party.)
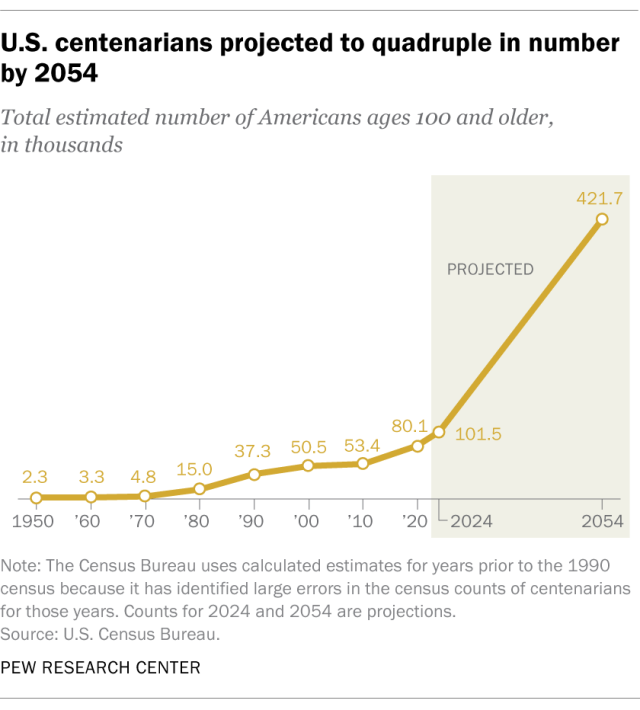
The U.S. centenarian population is projected to more than quadruple over the next 30 years. An estimated 101,000 Americans were 100 or older in 2024 – including former President Jimmy Carter, who reached the milestone in October. By 2054, the number of centenarians in the United States is projected to rise to around 422,000, according to a January analysis of U.S. Census Bureau data.
Today, 78% of Americans in their 100s are women and 22% are men. There are also racial and ethnic differences within this group: 77% of centenarians are White, while far fewer are Black (8%), Asian (7%) or Hispanic (6%). White adults are expected to still make up the majority of U.S. centenarians by 2054, though their share is projected to fall slightly to 72%. Asian centenarians are also expected to make up a smaller share by 2054 (5%), while the shares of Hispanic (11%) and Black (10%) centenarians will grow.
Projections from the United Nations put the global centenarian population at 722,000 in 2024. Japan is home to more centenarians than the U.S., at 146,000. The U.S. is second, followed by China (60,000), India (48,000) and Thailand (38,000).
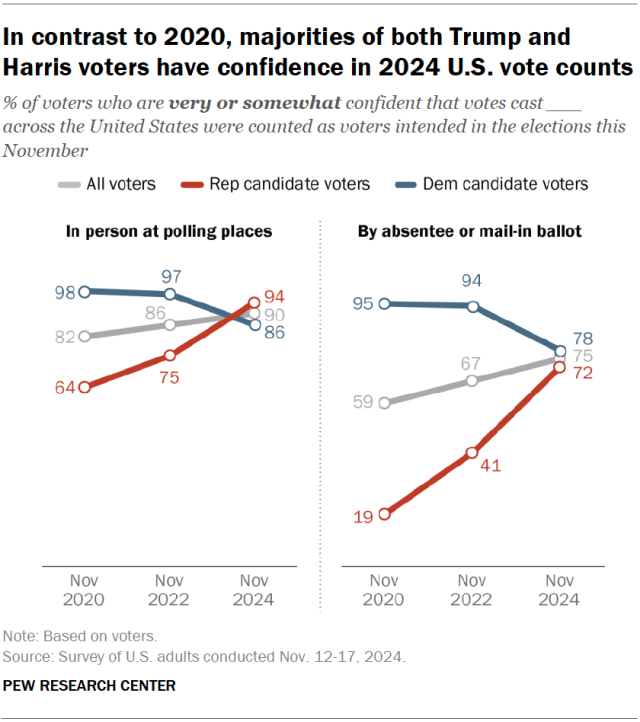
Republican confidence in U.S. vote counts surged after the 2024 presidential election, while Democratic confidence fell slightly. Around seven-in-ten voters who supported Republican Donald Trump (72%) are very or somewhat confident that absentee or mail-in ballots were counted as voters intended this year. Just 19% of Trump voters said the same after the 2020 election. Similarly, 94% of Trump voters are very or somewhat confident that votes cast in person at polling places were counted as intended – up from 64% in 2020.
Voters who supported Democrat Kamala Harris, by comparison, are slightly less likely than those who supported Democrat Joe Biden in 2020 to have confidence in U.S. vote counts. Still, large majorities of Harris and Biden supporters alike expressed confidence.
Most registered voters in the U.S. say immigrants – whether undocumented or legal – mostly fill jobs American citizens don’t want, according to an August survey. Three-quarters of voters say undocumented immigrants fill jobs citizens don’t want, as opposed to jobs citizens would like to have. A lower share, though still a majority (61%), say the same about legal immigrants.
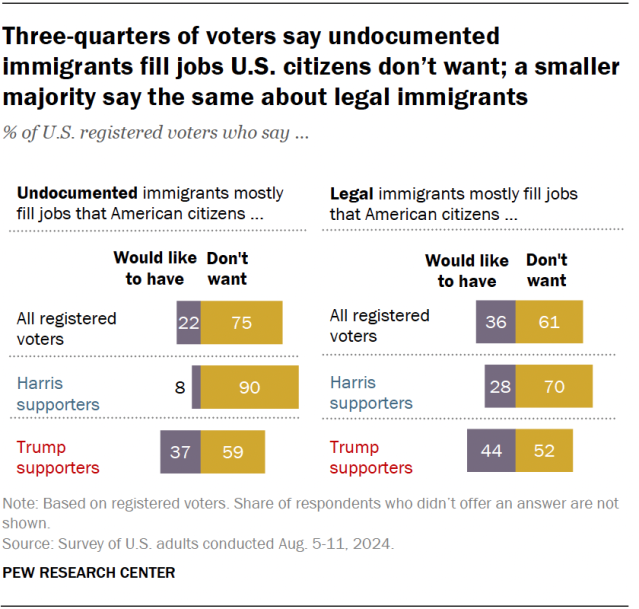
While there are large partisan differences in these views, majorities of voters who supported Harris for president this year (90%) and those who supported Trump (59%) both say undocumented immigrants mostly fill jobs Americans don’t want. Large shares in both coalitions – 70% of Harris supporters and 52% of Trump supporters – also say this about legal immigrants.
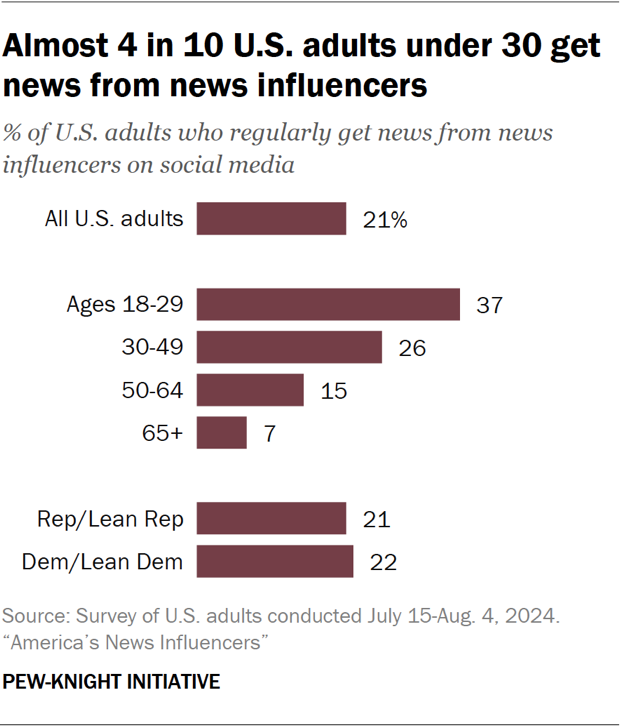
Many Americans, especially young adults, regularly get news from influencers on social media, according to a November study. About one-in-five U.S. adults (21%), including 37% of adults under 30, say they regularly get news this way. Most Americans who do so say influencers have helped them better understand current events and civic issues, and that the news they get from influencers is different from the news they get from other sources.
Who are these news influencers? Around three-quarters (77%) have no past or present affiliation with a news organization. Men outnumber women by a roughly two-to-one margin. And among those who express a political orientation, more identify as right-leaning than left-leaning.
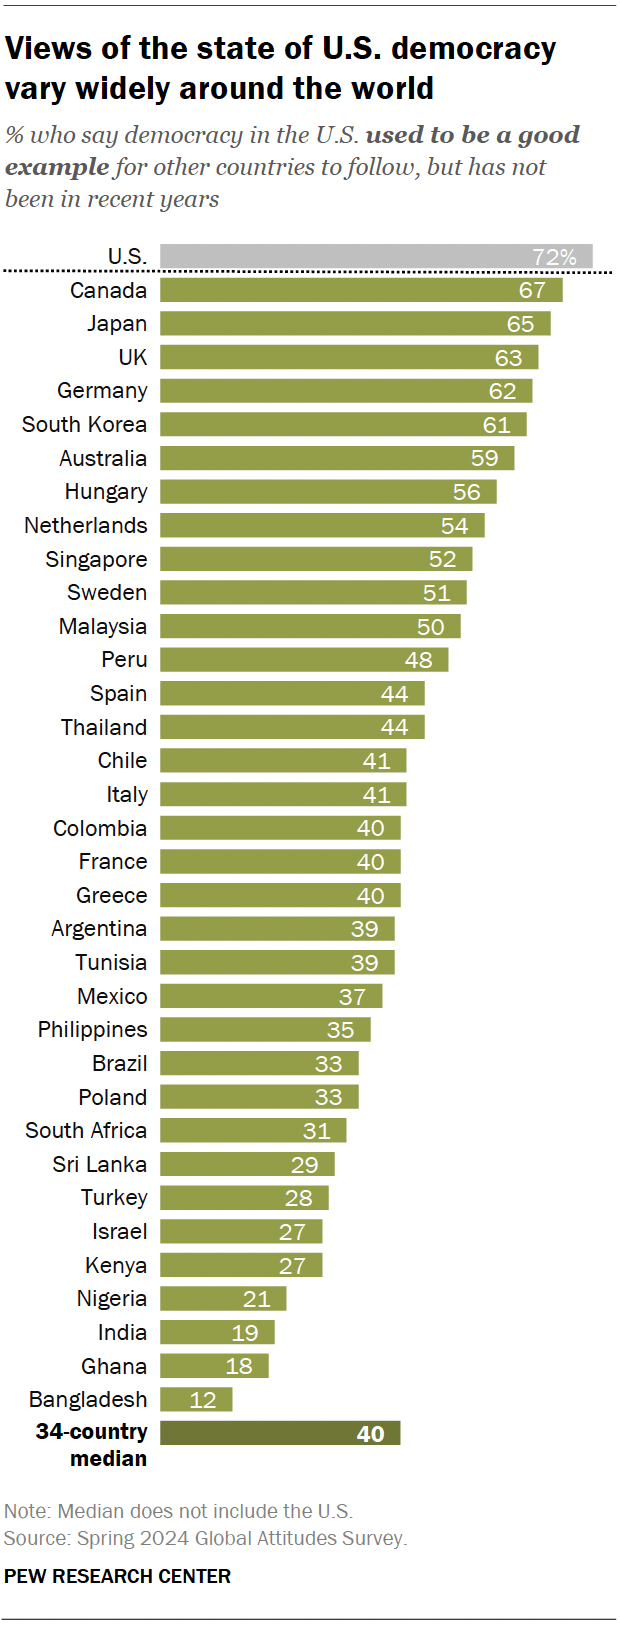
Most people across 35 countries say democracy in the U.S. used to be a good example for other countries to follow but has not been in recent years – or that it has never been a good example. Looking at the 34 non-U.S. countries we surveyed in spring 2024, a median of 40% of adults say the U.S. used to be a good example of democracy but no longer is. A median of 22% say the U.S. has never been a good example, while 21% say America continues to be a good example of democracy for other countries to follow.
Comparing these results with our U.S. survey, we find that Americans themselves are the most likely to say that their country used to be a good example of democracy but no longer is. Around seven-in-ten U.S. adults (72%) hold this view, as do at least six-in-ten adults in Canada (67%), Japan (65%), the United Kingdom (63%), Germany (62%) and South Korea (61%).
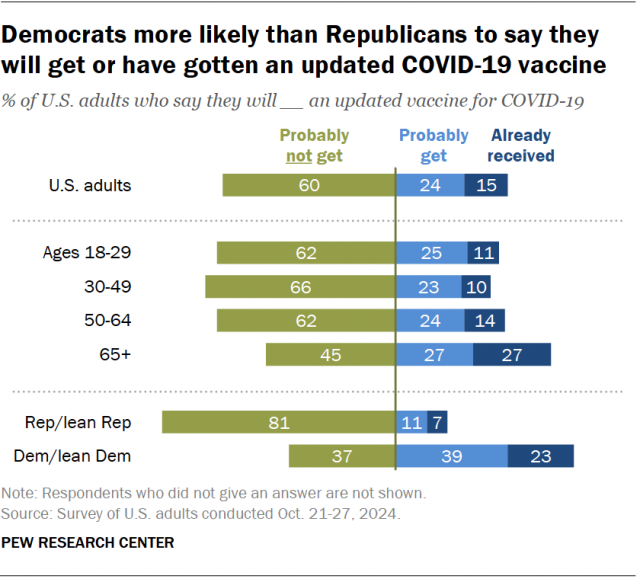
Six-in-ten Americans say they probably won’t get the 2024-25 COVID-19 vaccine, according to an October survey. Smaller shares say they probably will get an updated vaccine (24%) or have already received one (15%).
Democrats are more likely than Republicans to say they probably will receive or have already received the vaccine. That extends a trend seen throughout the coronavirus pandemic. Adults ages 65 and older are also more likely than younger adults to say they will get, or already have gotten, the 2024-25 vaccine.
Among Americans who say they probably won’t get the updated vaccine, the most common reasons are a sense that they don’t need it and concern about side effects.
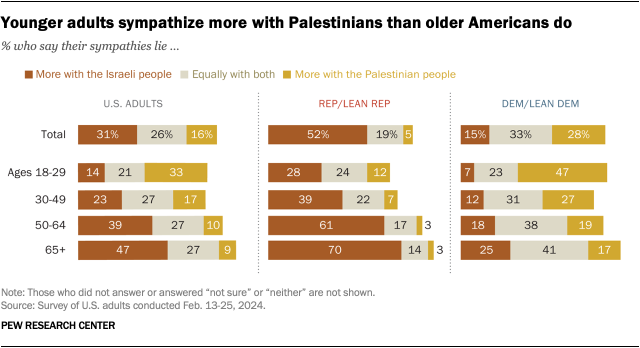
Younger Americans express more sympathy for the Palestinian people than the Israeli people, while the reverse is true among older Americans, according to a February survey. A third of U.S. adults under 30 say their sympathies lie entirely or mostly with Palestinians, while 14% say their sympathies lie entirely or mostly with Israelis. (The rest say they sympathize with both equally, sympathize with neither or are not sure.)
By comparison, 47% of those ages 65 and older sympathize entirely or mostly with the Israelis, while 9% sympathize entirely or mostly with the Palestinians.
Younger Americans are also especially opposed to U.S. military aid to Israel. Only 16% of adults under 30 favor the U.S. providing military aid to help Israel in its war against Hamas, compared with 56% of those 65 and older.
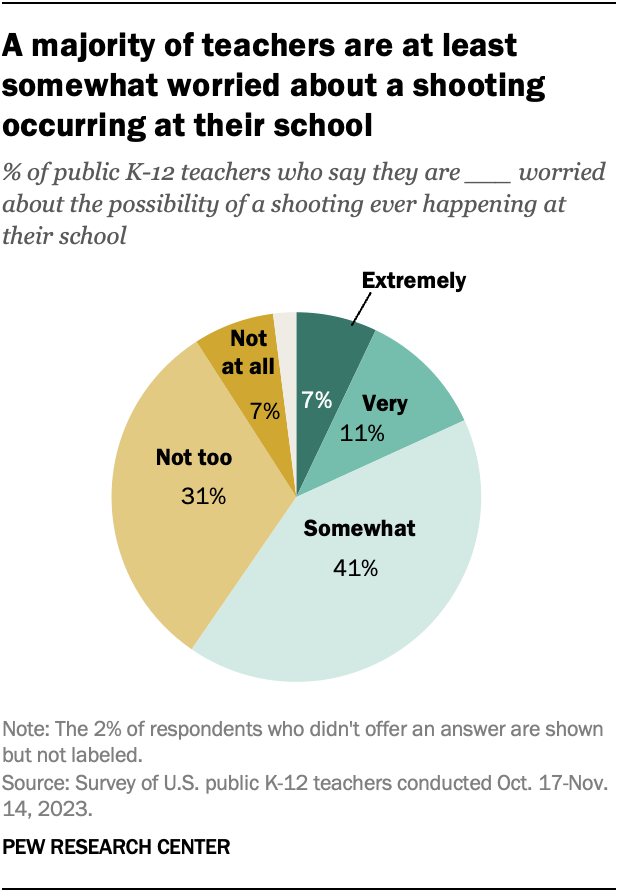
A majority of public K-12 teachers in the U.S. say they are at least somewhat worried about the possibility of a shooting ever happening at their school. About six-in-ten teachers (59%) say this, while 31% are not too worried and 7% are not at all worried, according to an April analysis of a 2023 survey.
In the same survey, 23% of teachers said they experienced a gun-related lockdown at their school during the 2022-23 academic year. That includes 8% who said this happened more than once.
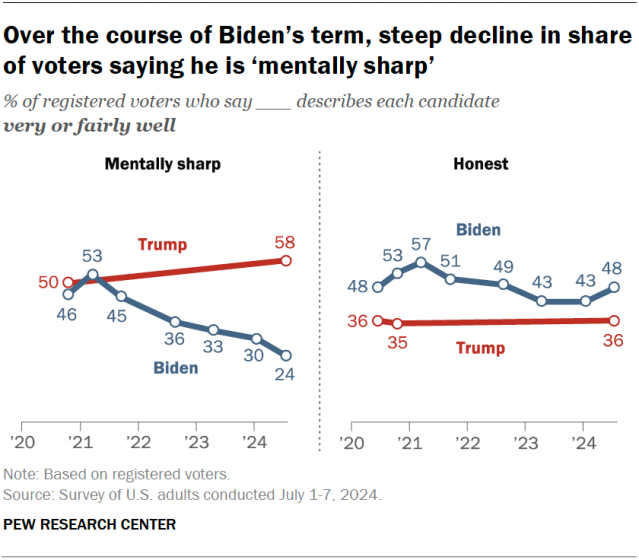
Voters’ perceptions of Joe Biden’s mental sharpness changed notably during his presidency, according to a July survey. In the final month of Biden’s 2020 presidential campaign, 46% of registered voters said “mentally sharp” described him very or fairly well. By April 2023, that share was down to 33%, and by July 2024, only 24% of voters described him that way. Biden announced on July 21 that he would not seek reelection.
By contrast, the share of voters who described Trump as mentally sharp increased from 50% in October 2020 to 58% in July 2024.
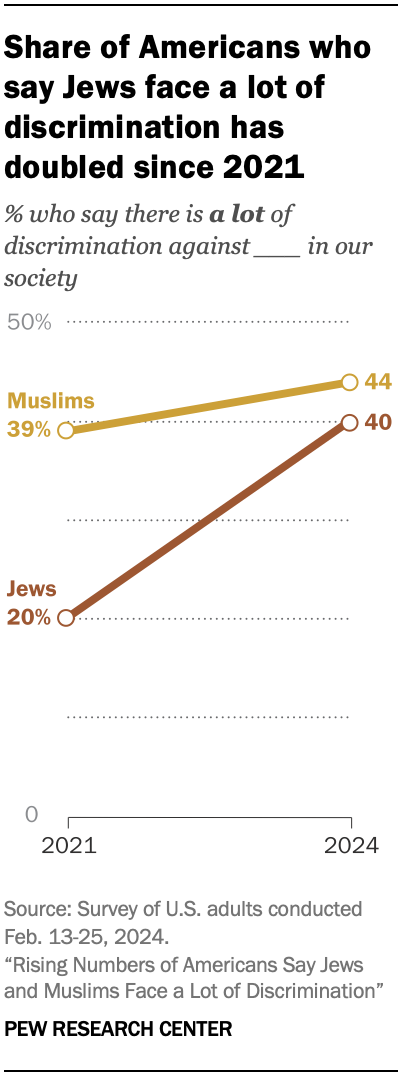
The share of Americans who say Jewish people face a lot of discrimination in society has doubled since 2021, according to our February survey, which took place about four months after the start of the Israel-Hamas war. Four-in-ten U.S. adults say Jews face a lot of discrimination in society today, up from 20% in 2021. Meanwhile, 44% of adults say Muslims face a lot of discrimination in society – up more modestly from 39% in 2021.
Most U.S. Jews and Muslims perceive a lot of discrimination against the group they belong to. In addition, 89% of Jews and 70% of Muslims say they’ve felt an increase in discrimination against their group since the Israel-Hamas war began in October 2023.
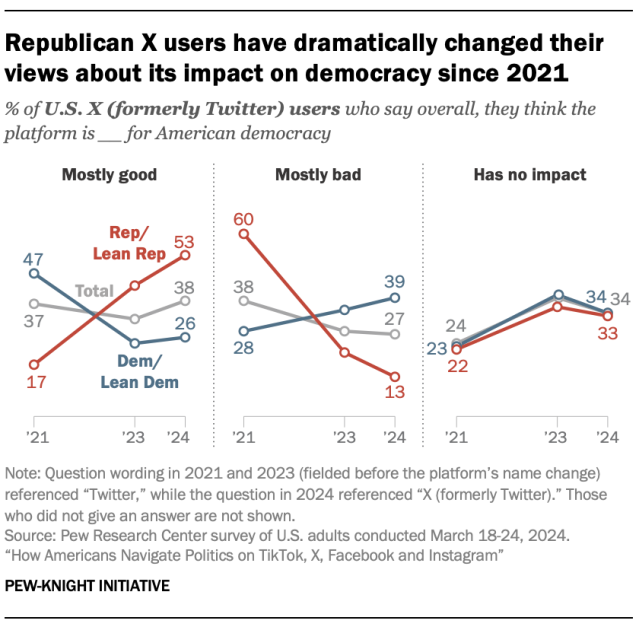
Republican X users have become much more likely – and Democratic users much less likely – to say the social media platform is mostly good for democracy. Around half of Republican users (53%) said this in a March survey. That’s up from just 17% in 2021, before Elon Musk purchased the site formerly known as Twitter. The share of Democratic users who say this has fallen from 47% to 26% during the same period.
Conversely, Republican X users are now much less likely to say the platform is mostly bad for democracy than in 2021, while Democratic users are more likely to say this.
Overall, 38% of users now say X is mostly good for democracy, 27% say it’s mostly bad and 34% say it has no impact on democracy.
Around four-in-ten webpages that existed in 2013 are no longer available today, according to a May study that examined “link rot” on the internet.
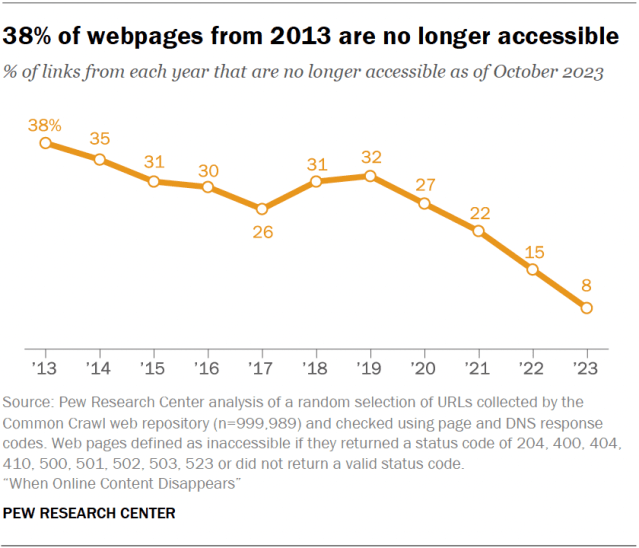
The share of webpages that are no longer accessible is higher for older content. While 38% of webpages that existed in 2013 were not available as of October 2023, the same was true for 8% of pages that existed in 2023.
Even for pages that existed in 2021, about one-in-five were no longer accessible just two years later. This is often because an individual page was deleted or removed on an otherwise functional website.
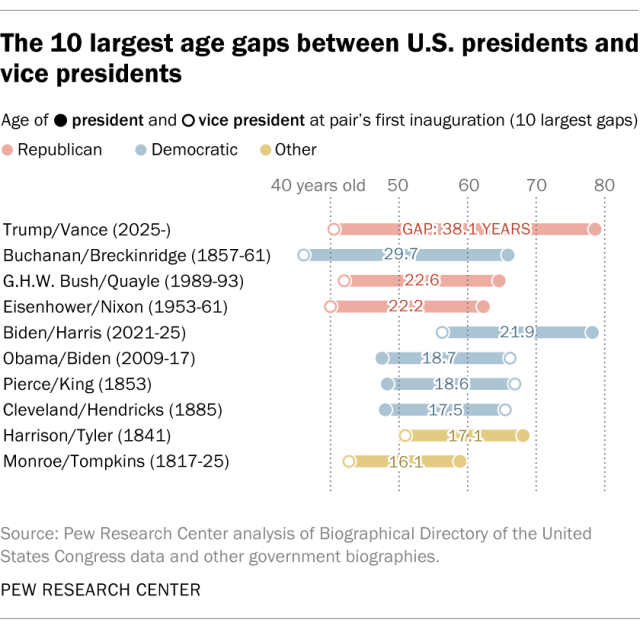
Donald Trump and JD Vance will be further apart in age than any president-vice president pair in U.S. history – by almost a decade. The two have an age difference of more than 38 years, according to an August analysis of all 51 executive pairs to have served. The largest age gap was previously 29.7 years: President James Buchanan, who served from 1857 to 1861, was nearly three decades older than his vice president, John Breckinridge.
The median age gap between all current and former U.S. presidents and their vice presidents is 6.7 years. Of these pairs, a majority (59%) have been closer than 10 years in age, while only four pairs (8%) have had an age difference of 20 years or more.
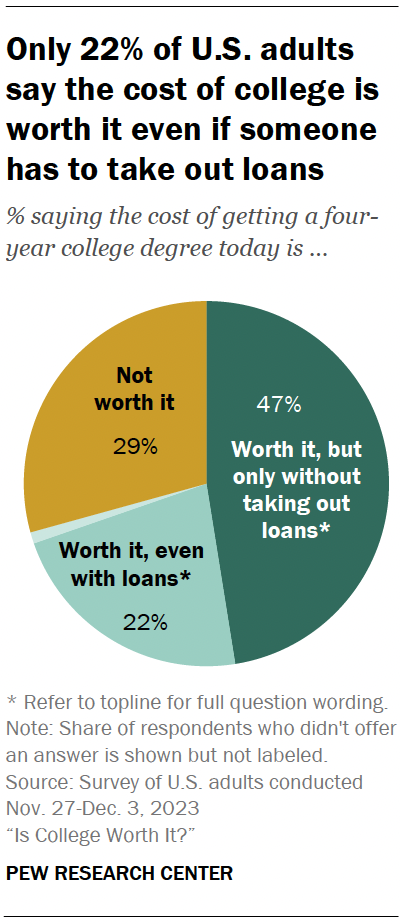
Just 22% of Americans say the cost of college is worth it even if someone has to take out loans, according to a May analysis. A larger share (47%) say the cost is worth it only if someone doesn’t have to take out loans, while 29% say the cost is not worth it.
Many Americans have grown somewhat skeptical of the value of a college degree. Roughly half (49%) say it’s less important to have a four-year college degree today in order to get a well-paying job than it was 20 years ago. Another 32% say it’s more important, and 17% say it’s about as important as it was in the past.